Oops! This Is What the TED-Spread Is Doing
April 11 2018
While Trump´s trade war is threatening to escalate (China reacted to Trump´s import tariffs by coming with an own list of import tariffs on U.S. exports, which was quickly followed up by Trump threatening to impose even more tariffs on Chinese imports), we can observe some interesting trends on credit markets. Yes, the yield curve is flattening even further. No, the long-term rate is not on the rise (contrary to what many analysts have been saying for the past three or four years). Yet, this time, I wanted to highlight the TED-spread. This credit market indicator did something rather surprising over the past month.
What Is the TED-Spread?
The TED-spread is the difference between the 3-month LIBOR (the interbank market rate) in dollars and the 3-month rate on Treasury Bills (the U.S. government rate). It is, in sum, the difference between the government rate and the “market” rate.
Why would the TED-spread rise?
The TED-spread rises when the demand for U.S. sovereign debt increases. An increasing demand for US Treasuries implies a lower yield on these bonds. Do not forget: U.S. sovereign debt continues to be the ultimate safe haven for financial markets in the case a crisis erupts. That is an important first point.
The second point is perhaps more important, because the TED-spread rises when the interbank rate rises as well. This particularly occurs whenever banks are confronted with seemingly insurmountable problems. The interbank market completely dries up, especially because banks no longer trust each other and become extremely cautious with regard to short-term loans to fellow bankers. The reason is simple. A short-term loan (say, an overnight loan) equals renouncing your own liquidity in order to lend it to another bank against a rather modest yield. But whenever the counterparty bank goes bankrupt, a bank´s very own temporarily renounced liquidity will not be promptly returned, which means that the bank that initially lent its liquidity can get into enormous trouble. This is what happened in 2007/08.
In these cases, interbank interest rates rapidly rise. Liquidity becomes scarce. Banks rather sit on their own liquidity than lend it. And the weakest banks, as a result, will be unable to survive. In short, if the TED-spread is high, it means in many cases that the interbank rate is high, which signals that banks are in great trouble.
What Is Happening with the TED-Spread?
Given our explanation above: to which surprise did I refer in the introduction?
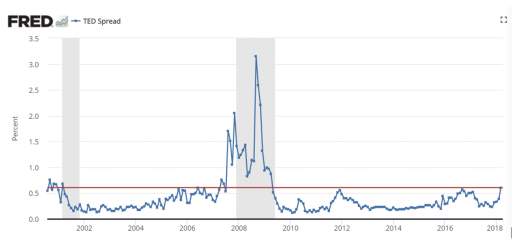
Observe the following chart:

The TED-spread since the dotcom bubble. Source: St Louis Fed
In the above chart, you can see the TED-spread over time. Recently (over the past month), it rose to 0.61 (61 basis points), which is also the level of the red line/curve.
Now, the last time that the TED-spread was this high, was in 2008/09, during the Great Recession. In 2017, the TED-spread rose quickly to somewhat below the same 61 basis points, but halted its rise. Surprisingly, in a relatively brief period the spread resumed its rise. In less than a month (in March), the spread began to rise again.
Of course, the TED-spread reached a record high during the 2008 crisis. At the time, the spread between the LIBOR rate and the U.S. government rate went ballistic: the rate differential reached an astonishing level of more than 300 basis points.
At any rate, the conditions on the interbank market are becoming rather tight. And the TED-spread is a witness of this recent development.
The Yield Curve Continues to Flatten
We have also discussed in great detail the yield curve spread, for instance here. Let us go back to the yield curve and see what has happened more recently. This way, we can conclude whether the flattening persists. An inverted or flat yield curve means that we are on the brink of a recession.
We will quickly see that the 10-year US Treasury rate, as I have emphasized on multiple occasions, is not rising at all. Even though analysts have been forecasting a higher 10-year US Treasury yield, exceeding the “magic level” of 3%, year after year, the exact opposite is happening. Here a summary of the median forecasts of analysts over the years:

Source: Ferguson-Johnson Wealth Management
In the above chart, the black curve is simply the rate on 10-year US Treasuries. That interest rate dropped recently (as we will see later) to below 2.8%. On the other hand, the colored lines are the median forecasts that have been made year in and year out. What surprises, is that analysts consistently think that interest rates will rise and, moreover, predict that government yields reach the 3% barrier within no-time. Nonetheless, nothing could be further from the truth over the past years.
Let us quickly take a glance at what the yield curve and the 10-year US Treasury rate are doing:

Blue curve is the 10-year US Treasury rate, red curve is the 3-month LIBOR in U.S. dollars. Source: St Louis Fed
We can observe that over the past month the 10-year US Treasury rate is falling, in contrary to what (almost) all analysts consistently forecast. We can also see that the 3-month LIBOR is continuing its unprecedented rise. Last week, this short-term interest rate benchmark reached a level of 2.33%. All the while the 10-year US Treasury rate dropped to below 2.8%. This implies that the yield curve spread is still falling at a frightening pace.
While these and other interest rate signals prove that a recession is becoming increasingly likely, we should normally expect that we have some time before a recession truly erupts. But the yield curve is flattening even further, long-term interest rates are not rising but falling, and the TED-spread rose to levels at which it stood in 2007. In effect, temperatures are gradually on the rise, but we have not yet reached a boiling point. We are, however, coming dangerously close.