The Last Time Corporate Earnings Declined, This Happened
February 9 2015
Many people believe that the U.S. economy is recovering. But what if the opposite is true? What if the U.S. economy will be hit by a new recession sooner rather than later? A recession will have major, negative consequences for your financial wealth. This week, I have three graphs in store for you. Just to give you an idea: we are talking about an outright (financial) hurricane warning.
The Last Time Corporate Earnings Declined, This Happened
Many people believe that the U.S. economy is recovering. But what if the opposite is true? What if the U.S. economy will be hit by a new recession sooner rather than later? A recession will have major, negative consequences for your financial wealth. This week, I have three graphs in store for you. Just to give you an idea: we are talking about an outright (financial) hurricane warning.
Warning #1: the Last Time Corporate Profits Dropped, This Happened …
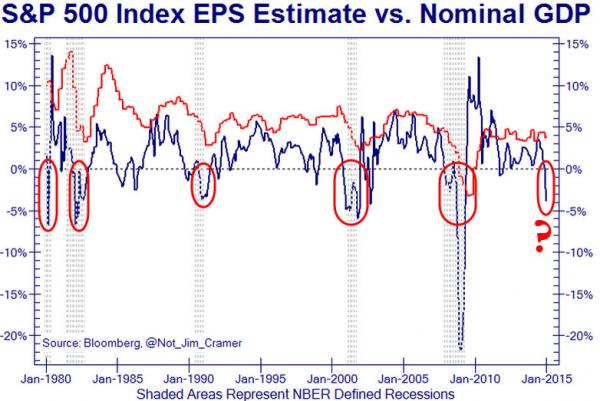
It is not common for markets to expect corporate profits (earnings per share) to drop. But every time it does happen, it is an indisputable indication that a recession is ahead.
Or to be more precise: since 1980 every recession was preceded by a widespread expectation of dropping corporate profits.
This may not come as a surprise: expected corporate profits have been significantly negative since the beginning of the year.

For anyone following the mood on Wall Street with a down-to-earth mindset, this should not be a surprise. Indeed, many top executives already hinted at depressed corporate profits, among others due to the strength of the dollar. Due to the strongly increased exchange rate of the dollar, U.S. corporations are faced with dropping profit margins.
Nor should it be a surprise for you that corporate profits will drop this year. After all, corporate profits were at a record high in 2014. Indeed, in the 4.54 billion year-history of our cherished planet, corporate profits have never been as high.
What happened last time that corporate profits declined, as they do now in 2015? The last time was in 2007, and what followed was the 2008 financial hurricane, which was among the most destructive of all times. Considering the indicator’s flawless record since 1980, we should expect another devastating storm to be ahead. What will be destroyed? Pensions and equity values will smashed to pieces, especially if interest rates remain unchanged (pension funds compute their future liabilities on the basis of interest rates).
Warning #2: God Forbid If the Yield Curve Inverts
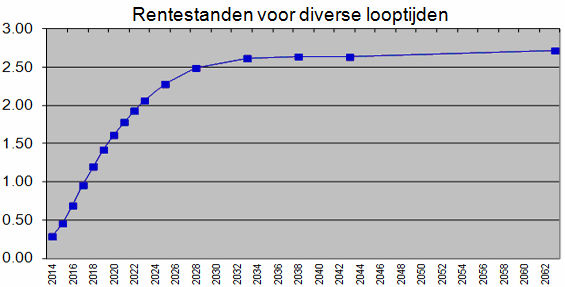
A yield curve normally looks like this:
 ?
?
Long-term debt yields higher interest rates than short-term debt. The reason, of course, is the larger risks that are inherent to long-term lending: inflation, bankruptcies, etc.
But every now and then, short-term interest rates are higher than long-term interest rate. This is exactly what indicates that we are on the verge of a recession. Even the infamous Ben Bernanke — former chairman of the Federal Reserve— studied the “inverted yield curve” in detail. Nevertheless in 2007, he dared to argue that the inverted yield curve did not mark economic turmoil. Of course, you know what happened next; we experienced the biggest recession since the Great Depression with a capital D.
Now it is true that we — people — are conducting the biggest monetary experiment in history. Not only is indebtedness extraordinarily high (has happened before), but central banks worldwide keep interest rates at zero. Interest rates have never been this low. As such, it may be true that this indicator is less “effective” this time.
 ?
?
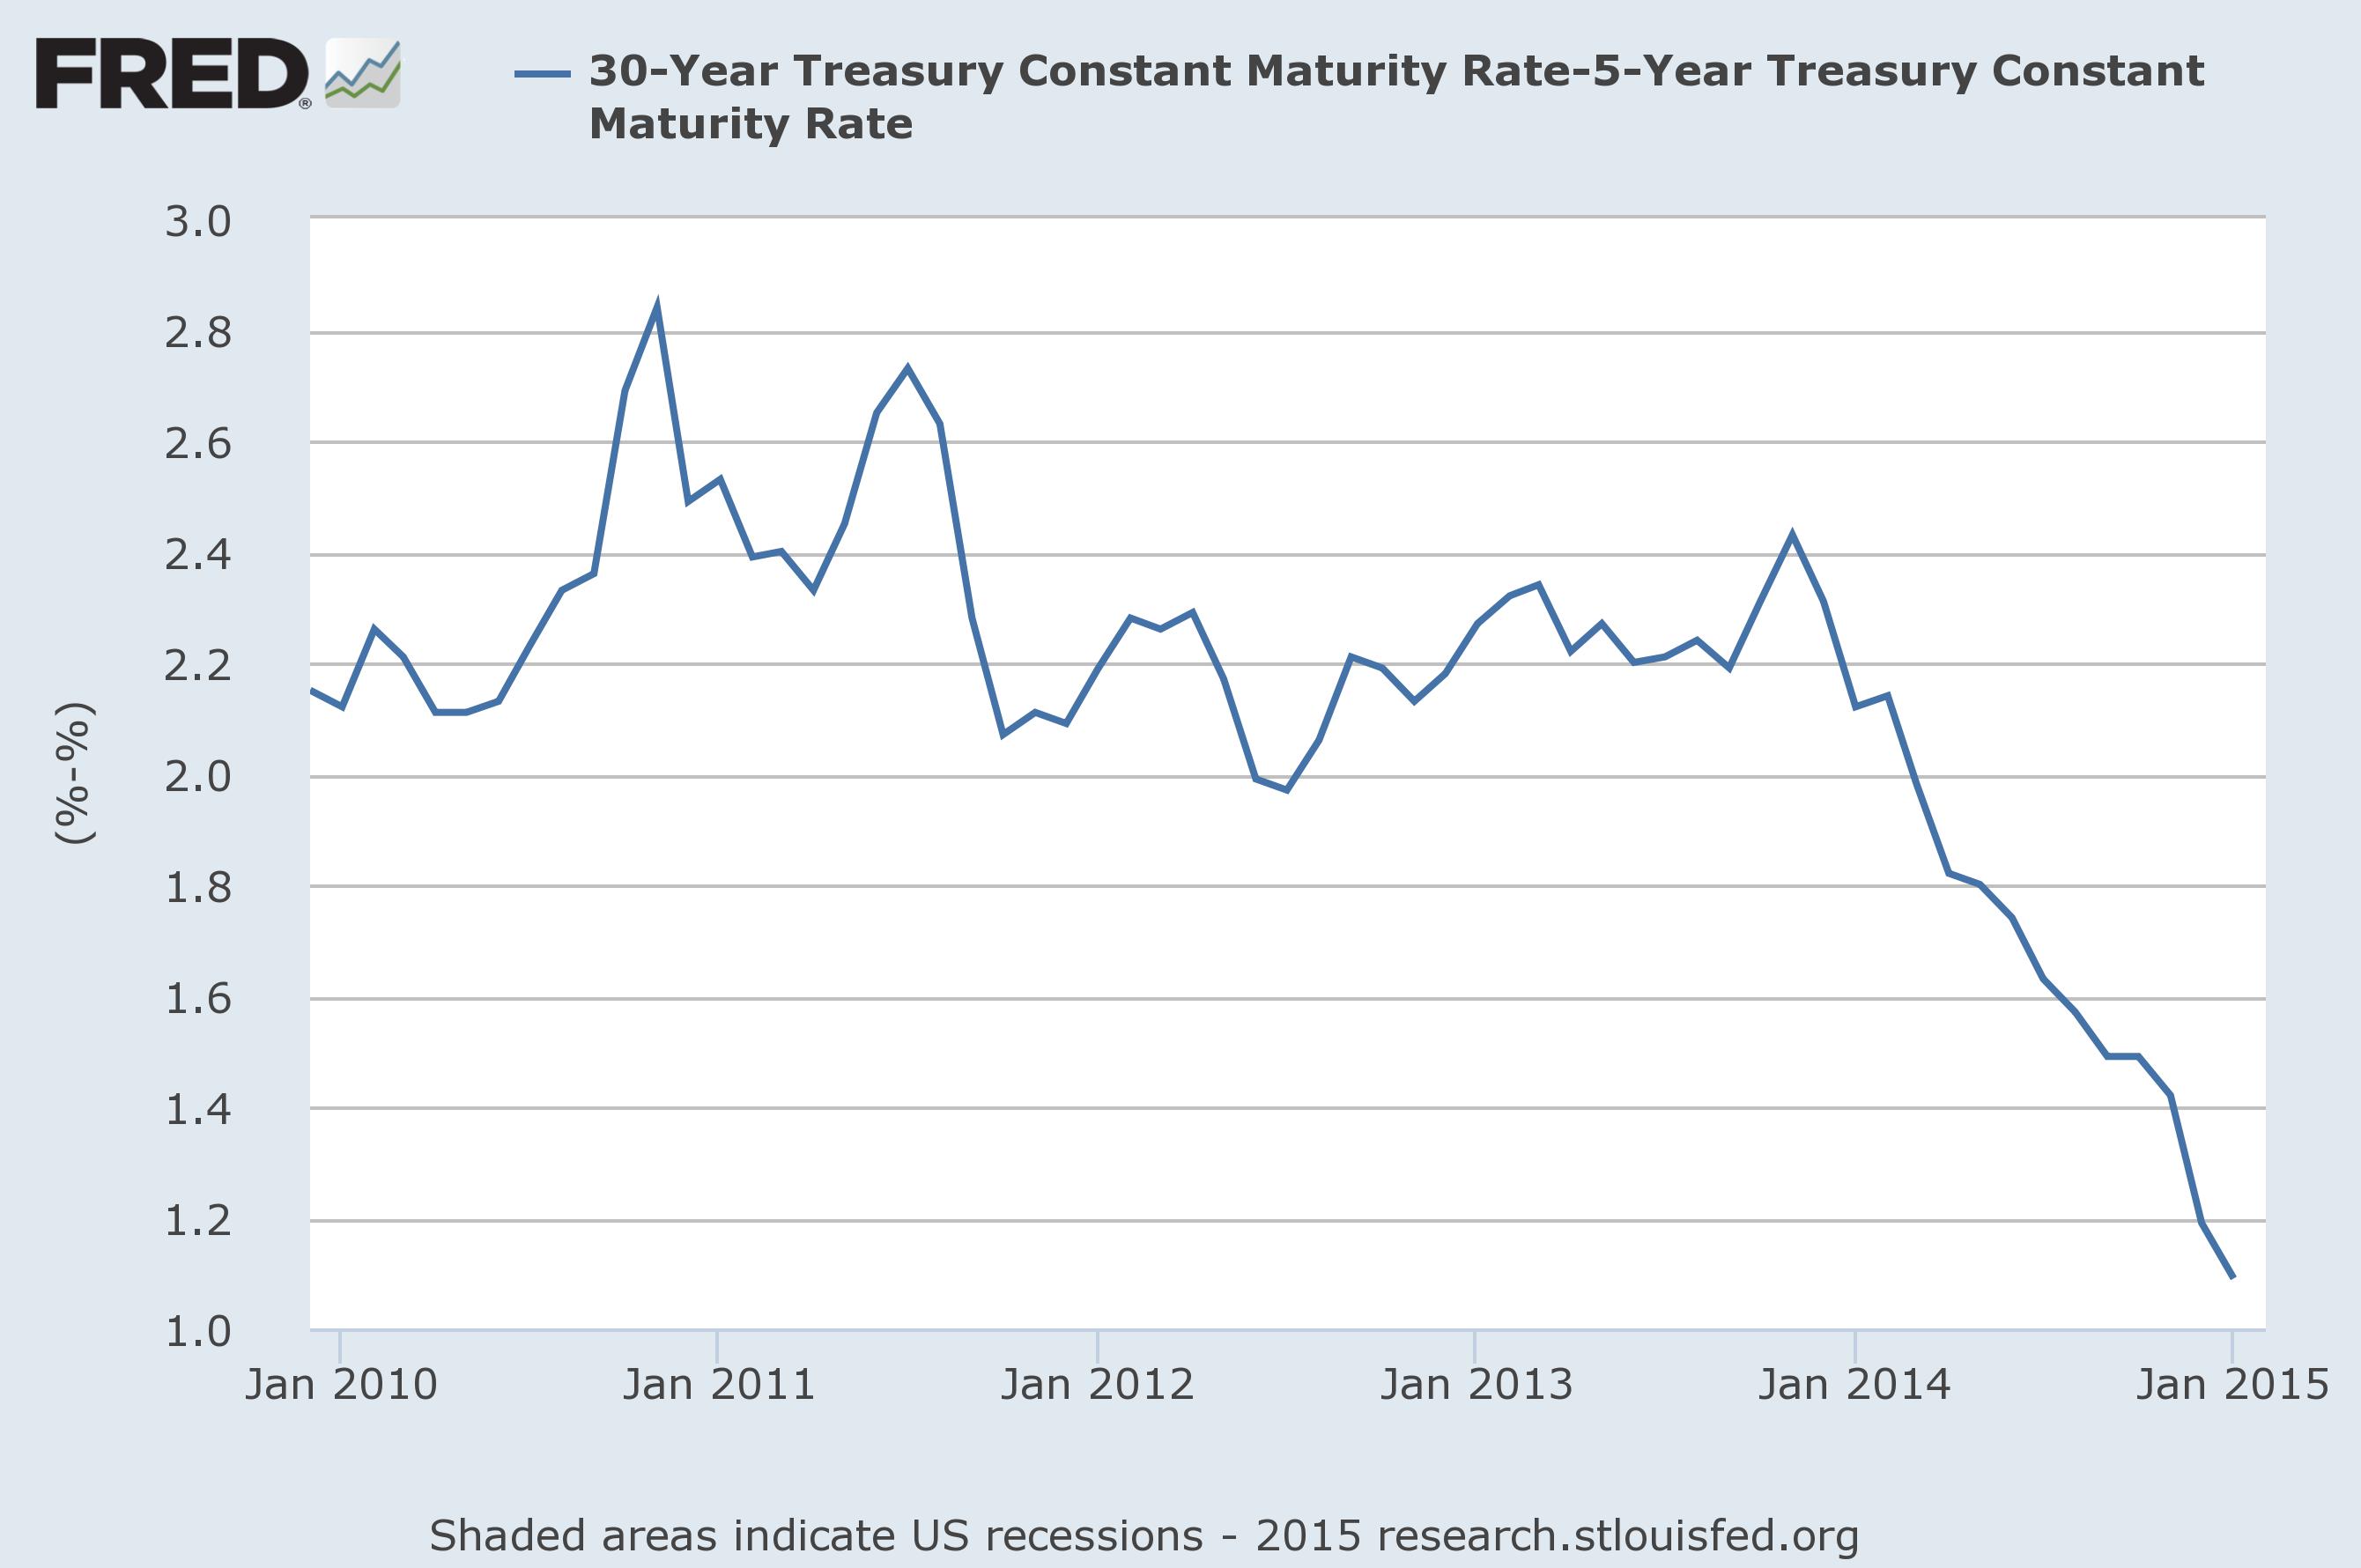
Whatever the case, the yield curve is currently flattening strongly. And this is bad news for the economy and your equity investments.
Warning #3: the Only Ratio You Need to Know Is Indicating Trouble
Sometimes I get asked what the most important ratio on the stock exchange is. If I had to pick one figure, what would it be?
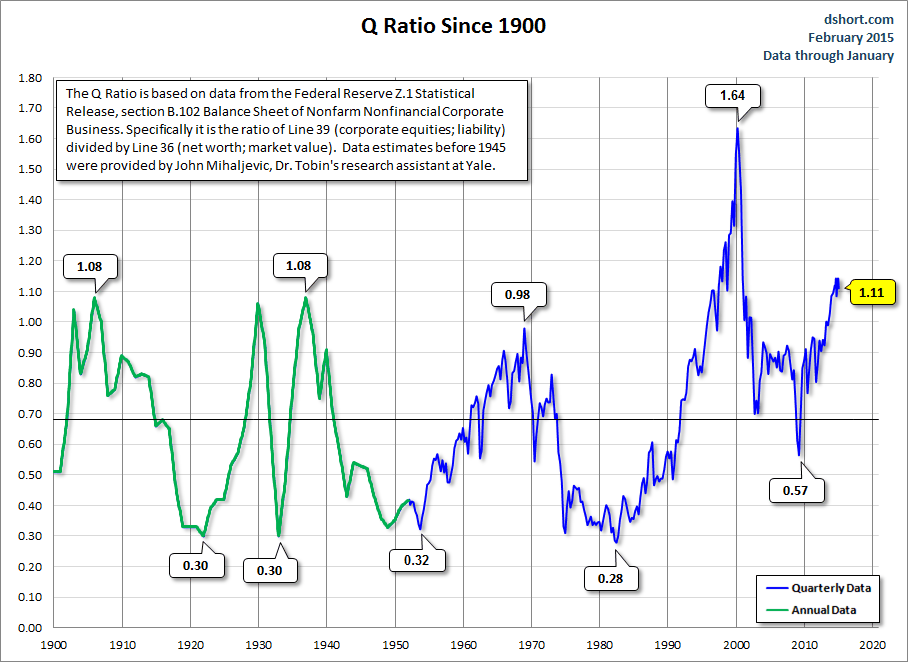
My definite answer is the Equity Q Ratio. In a nutshell, Q shows by how much the weighted average cost of capital of a company diverts from the return on investment of a company. This amounts to how many dollars are paid on the stock exchange for one dollar of equity.
This ratio always tends towards equality, just like demand and supply tend to be equal to each other due to arbitrage. If high prices are paid for corporate assets on the stock exchange, why not simply buy the assets and undertake the business operations yourself? And vice versa: why buy corporate assets, if it is cheaper to buy ownership (a share) in someone else’s corporate assets? The ratio paves the way for profitable opportunities and therefore always tends towards equality.
Q shows how attractive stocks are. Shares are often more attractive during or just after a recession, and the least attractive just before a recession (people pay for their excessive optimism). The higher Q is, the bigger the risk of a recession.
Right now, Q is at its second-highest level of all times (Q was only higher in 2000). More to the point: Q implies that stocks are overvalued by 63%.

Obviously, Q does not tell us exactly when a recession will strike. But no single figure does. The only thing it tells us, is how likely a recession is to strike. And Q is crystal clear about that, a recession and disappointing rates of return on equity are inevitable.
A Recession Is Inevitable
Considering a recession will strike sooner rather than later, we need to make precautions. How will you prepare?